|

|
Compuware EcoTOOLS
Managing enterprise health and availability
for Windows NTEcoTOOLS manages health and availability in rapidly expanding NT enterprise
environments. It monitors, manages and reports on key availability and performance
metrics, helping to ensure the health and availability of your Windows NT applications are
maintained at optimal levels.
The information presented here provides an introduction to EcoTOOLS
and its powerful service level management capabilities. For specific information on the
benefits provided by EcoTOOLS, please select any of the following topics:
EcoSYSTEMS
EcoTOOLS is an integral part of EcoSYSTEMS, Compuware's suite for
enterprise application service level management. The EcoSYSTEMS suite consists of EcoTOOLS
for improving application availability through better application management at multiple
levels of databases, application servers, operating systems and networks; EcoSCOPE for
optimizing application performance; and EcoSNAP for rapid recovery from application
failures.
For more information on EcoTOOLS, or any EcoSYSTEMS products, please
contact us either by phone or on the web at: http://www.compuware.com/products/ecosystems/for_more_information.htm
Immediate out-of-the-box
value
An investment in health and availability management is critical by
its nature. Management software must demonstrate immediate value. EcoTOOLS does
just that. By requiring no scripting whatsoever, EcoTOOLS simplifies the planning and
deployment process. Even determining what to monitor is made easy using application
templates.
Take a look at some of the built-in value that EcoTOOLS provides:
Predefined application templates contain
business logic to monitor health, availability and performance of the Windows NT server
and critical applications.
Customizable packaged reports use gathered
information to summarize application availability and performance, and provide service
level documentation.
Automatic server and application discovery saves
time by eliminating extensive configuration and setup.
The Graphical Policy Builder
 |
please click the image
to the left to see a
larger version |
allows you to build and customize management
tasks with business rules that reflect your business service level management policies without
scripting.
Unmatched data monitoring
If you can’t effectively monitor your NT servers and
applications, you will not be able to manage them. EcoTOOLS provides greater depth by not
only taking advantage of built-in Windows NT management facilities, including the Windows
NT performance registry, but also by monitoring application and service data that simply
are not available from other sources.
- By monitoring Microsoft Performance Registry Counters, EcoTOOLS
automatically manages any application that writes performance data or counters to the
registry.
- Extended system data provides information about Windows NT
service status, CPU utilization, printer status, memory utilization, file system
utilization, and other key availability metrics that are not available through the
registry.
- Extensive NT Log File analysis helps ensure
that critical messages from your NT event, security and application logs are captured and
forwarded to a central location.
- Application Log File analysis lets you monitor virtually any
application that writes to its own logs.
- Extended Microsoft Exchange support provides Exchange-specific
information not currently available, including user-specific information from the Exchange
database as well as information about -- and corrective actions for -- Message Transfer
Agent analysis.
- Extended Lotus Notes support goes beyond the information
available in the NT Registry to provide additional support for replication, tracking
message delivery, checking Domino server status, and tracking database size.
- Novell NetWare support directly monitors NetWare servers,
allowing you to set thresholds, apply service level policies, and graph data for important
metrics such as CPU utilization, available memory, printer status, number of users logged
on, and more.
- Extended Microsoft Internet Information Server (IIS) support for
tracking your own internal customers, providing numerous statistics for reporting on items
such as total hits per domain and web page.
- Extended SQL Server support includes templates and reports
specifically enhanced for MS SQL Server 7.0, as well as the ability to monitor and view
specific SQL statements.
- Extended Oracle agents provide metrics that may be used in
conjunction with Oracle Registry counters to monitor the health and availability of Oracle
databases, including tablespace, fragmentation and status of the individual databases
- Extended SAP agents provide metrics for checking the
availability of SAP instances and other SAP system metrics, as well as allowing access to
metrics from the local MIB of the SAP instance.
- Real-time, near-time, and historical data facilitate timely
notifications, accurate trending and historical analysis of critical availability data.
Comprehensive event
management
As the number of Windows NT servers grows, managing event logs and
ensuring that critical events are addressed quickly becomes increasingly difficult. At the
same time, user expectations for availability are also increasing. To meet service level
expectations, IT staffs need to first aggregate events; next consolidate events into a
central repository; and finally centralize event management. EcoTOOLS provides
comprehensive and centralized event management that frees your IT staff to perform other
functions.
- Rule-based event filtering gives IT organizations the ability
to ensure that only relevant events are raised.
- Event escalation within the IT organization can be specified
using a hierarchy of rules.
- Real-time event notification alerts IT staff to events as they
occur, rather than after the fact, which allows IT to respond more quickly.
- Paging facilities enable servers and applications to run
unattended, and still receive attention from when critical events occur.
- E-mail provides event notification as well as an audit trail
of events.
- Corrective actions enable automatic response to critical
events at machine speeds, rather than human speeds.
- Monitoring and restarting services using the extended system
data and corrective actions allows applications to be restarted quickly, which reduces
outages.
Service
level reporting
 |
please click the image
to the left to see a
larger version |
Effective reporting is essential for meeting service level
expectations. Reports facilitate planning and trend analysis. They also form the basis for
conversations about how well service levels are being met. EcoTOOLS provides the following
comprehensive set of customizable reports:
- High-level and detailed views of reports are available for
summarizing management information as well as for detailed analysis and trouble-shooting.
- Availability reports for Windows NT servers and applications
describe the availability history to show at a glance where problem areas may exist.
Reports are prepackaged for key Microsoft BackOffice applications, Lotus, Oracle, SAP and
others.
- Performance reports relate information about performance
metrics that can be related to the health of applications and servers.
- Configuration reports document the logic that has been
captured in business policies and rules. These are helpful to IT staff in recalling
implemented policies and planning for changes.
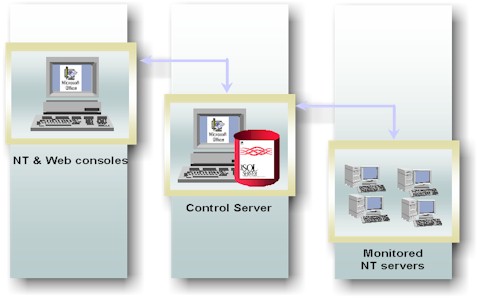
Enterprise environment
architecture
To meet the demands of expanding enterprise environments, EcoTOOLS
employs a three-tier architecture that allows managed servers and control components to
operate independently, and to survive and recover from network and system outages.
Additionally, EcoTOOLS has been developed with flexibility to handle your enterprise
requirements. EcoTOOLS’ three-tier
architecture
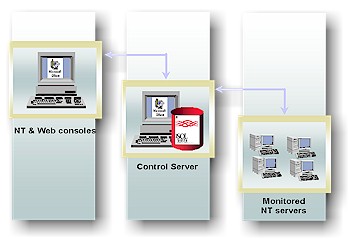 |
please click the image
to the left to see a
larger version |
facilitates recovery from outages by
allowing managed servers to operate in a disconnected mode, continuing to collect data.
When events occur, the managed server will reconnect and forward event information.
- Native Windows NT capabilities are fully exploited in
EcoTOOLS, not only in the user interface, but also in the underlying technology, taking
advantage of native Windows technologies such as SQL Server and COM. This results in
efficient operation in your Windows NT environment.
- UNIX monitoring capabilities are integrated into
EcoTOOLS, allowing an administrator to discover tasks, control the operation of those
tasks on the UNIX servers, and receive and acknowledge events from UNIX servers.
- A Web Browser console allows IT staff to navigate the
enterprise intranet, viewing events and data and acknowledging critical events without
returning to the Windows NT console.
- A robust datastore forms the foundation for storing data and
persisting events from the NT servers. Use of a standard commercial datastore greatly
enhances the scalability and robustness of the product. It also permits the generation of
custom reports in unique cases where standard reports cannot meet enterprise-specific
requirements.
- Highly scaled environments demand tools that scale easily and
seamlessly. EcoTOOLS scales to manage up to 200 servers with a single control server,
based on data collection requirements.
- SNMP Trap forwarding and receipt allows you to send traps
directly to multiple destinations, including frameworks, providing meaningful application
availability and performance information. In addition, the SNMP trap receive capability
facilitates integration of other management tools for a centralized view of events.
EcoTOOLS
reports and application templates
Business Policy Configuration
Lotus Notes User Statistics
Lotus Notes Availability
Lotus Notes Performance
Microsoft Exchange User Statistics
Microsoft Exchange Availability
Microsoft Exchange Performance
Microsoft Internet Information Server User Statistics
Microsoft Internet Information Server Availability
Microsoft Internet Information Server Performance
Microsoft SQL Server Availability
Microsoft SQL Server Performance
Oracle Availability
Oracle Performance
SAP R/3 Availability
SAP R/3 Performance
Windows NT Availability
Windows NT Performance
EcoSNAP Events
NetWare Availability
NetWare Performance
EcoTOOLS Events and Acknowledgements
Note: for a comprehensive list of templates and reports, please
contact your sales or customer service representative, as these components are being
updated regularly.
Getting More Information
For additional information regarding EcoTOOLS and how it will make
use of WMI/WEBM facilities, please consult the following Web site:
http://www.compuware.com/products/ecosystems/win2000.htm
At this location, you will find the following information:
- How EcoTOOLS for Windows NT exploits the WMI/WBEM facility
- The benefits of being able to provide and consume WMI/WBEM
information
- Updated examples/samples of WMI agents
- Updated MMC snap-in used to consume WMI information
- Managing Service Levels using EcoTOOLS for Windows NT
- Information about EcoTOOLS for Windows NT product capabilities
- Product information on other EcoSYSTEMS products that integrate to
manage service levels
What's included in this CD
This CD-ROM includes an introduction to Compuware
EcoTOOLS support for Web-Based Enterprise Management (WBEM). EcoTOOLS provides
instrumentation to enhance WBEM for supporting the Windows 2000 (Build 2000 and
above) and Windows NT 4.0 environments. When used with the EcoTOOLS Microsoft Management
Console Snap-in included in this CD, you'll get an interactive view of some system
statistics
 |
please click the image
to the left to see a
larger version |
(physical memory usage, swap space usage,
and CPU utilization) and the top processes
 |
please click the image
to the left to see a
larger version |
for your machine.
What are EcoTOOLS WBEM instruments?
EcoTOOLS has defined some instruments to monitor the select
data about your computer system. Included are two "instruments" (data measuring
tools) that let you gather this information. One, the "System statistics"
instrument, measures the current physical memory utilization, swap space utilization, and
CPU utilization of your system. The "Top processes" instrument lets you view
which processes are either using the most memory, are using the most CPU time, or are
currently having the most page faults.
How to install?
To install the EcoTOOLS WBEM instruments and the
Snap-in, insert the Microsoft Windows 2000 CD-ROM in the CD drive, then run the setup.exe
program located in the Compuware directory (For example,
D:\valueadd\mgmt\agents\cmpuware\setup.exe).
How to view the EcoTOOLS WBEM instruments through MMC
Snap-in?
The best way use the EcoTOOLS WBEM instruments is to run the
Microsoft Management Console Snap-in. The EcoTOOLS MMC Snap-in gives you an interactive
view of some system statistics (physical memory usage,
swap space usage, and CPU utilization) and the top processes
for your machine. Once the EcoTOOLS installation is complete, the Snap-in can
be loaded from an MMC console by following these steps.
- Type mmc in any "Command Prompt" window or
"Run" window to start the MMC console.
- Select "Add/Remove Snap-in" from the Console menu.
- In the new window that appears, click on Add.
- Select "EcoTOOLS Instrument Viewer" from the list
that appears and click on OK.
- A window appears which lets you configure the snap-in. Use the
arrows in the top pane to select the frequency to gather data. The bottom pane lets you
configure the initial settings for gathering data about processes. Select whether you want
to sort the processes by how much physical memory they are using, by their current CPU
usage, and by their recent page faulting activity. This lower pane also lets you select
how many processes to monitor. Click on Finish when you are doing configuring the snap-in.
- Now you are back to the Add/Remove Snap-in pane. Click on OK
to finish the addition of the EcoTOOLS snap-in.
- You can now use the snap-in. Click on the + sign next to the
EcoTOOLS Instrument Viewer in the left pane. You will see the two available instruments:
System Statistics and Top Processes.
- Using the right mouse button, click on the instrument you want
to run. In the menu that appears, select Start. The data for that instrument will start to
appear in the right hand pane at the frequency you selected. It may take a moment for the
initial data to be gathered.
- To stop the instrument, use the right mouse button to click on
the instrument name and select Stop.
- To change the setting for an instrument, for example to change
the data collection frequency, use the menu from the right-mouse button to select
Properties. From there you can change the parameters.
For more information
Please visit the Compuware EcoSYSTEMS web site at http://www.compuware.com/products/ecosystems/
or contact our corporate headquarters and ask to speak with an EcoSYSTEMS representative.

31440 Northwestern Highway
Farmington Hills, Michigan 48334-2564
(800) 521-9353
Compuware, EcoSCOPE, EcoSNAP,
EcoSYSTEMS and EcoTOOLS are trademarks or registered trademarks of Compuware Corporation.
All other company or product names are trademarks of their respective owners.
© 1999 Compuware Corporation |